Powered by FEMA National Risk Index
How risky is your county?
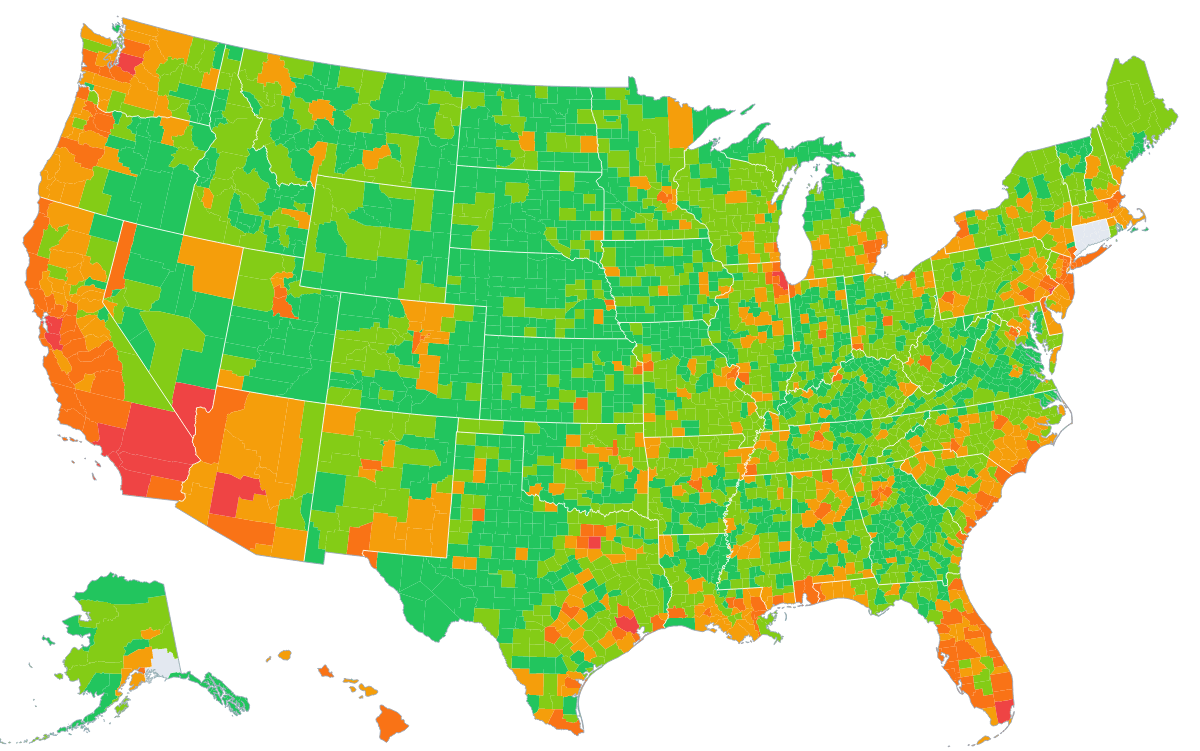
Free natural disaster risk data for every US county, powered by FEMA's National Risk Index.
3,232 US counties covered · v1.20 · Updated December 2025
County Risk Rankings
↑ Highest Risk Counties
Full rankings: 100 Riskiest Counties · 100 Safest Counties · Riskiest States · Safest States
Browse by Hazard
FEMA tracks 18 natural hazard types. Click any to see the riskiest US counties.
What is the FEMA National Risk Index?
The National Risk Index is a public dataset from the Federal Emergency Management Agency that rates every US county's relative risk from 18 natural hazards — hurricanes, floods, wildfires, tornadoes, earthquakes, and more. Each county's score (0–100) blends three ingredients: Expected Annual Loss, the average dollar damage the county should expect per year; Social Vulnerability, how susceptible its population is to harm; and Community Resilience, its capacity to recover.
The scores are relative, not absolute — a score of 85 means higher calculated risk than about 85% of US counties, not an 85% chance of anything. And they're county-level: a Very High flood county still contains homes that will never flood. That makes the index best for comparing places and spotting which hazards deserve your attention, and worst for judging a specific address.
This site publishes FEMA's numbers as-is and adds navigation, per-county disaster history, and human-written guides. Start with how the index works, or browse the hazard guides for what each risk means in practice and how to prepare.
About the Data
All risk data comes from the FEMA National Risk Index (NRI) v1.20, released
December 2025 under OpenFEMA's public-domain terms. Each county's composite score combines Expected
Annual Loss, Social Vulnerability, and Community Resilience across 18 hazard types.
DisasterRiskIndex.com is not affiliated with FEMA. Data is county-level only — not address-specific. This is not
insurance or financial advice.